
Knowing how to calculate safety stock lets you set a reserve of raw material that absorbs usage spikes and late supplier deliveries. Without that reserve, flour or sugar that runs out suddenly can halt a production line, while an oversized reserve ties up cash and crowds the warehouse.
For dry raw materials such as wheat flour and sugar, the calculated figure still needs adjusting to shelf life and warehouse capacity. Safety stock that is too large can expire or clump before anyone uses it.
This article covers the data to prepare, three common formulas, a worked example for wheat flour, and adjustments specific to dry materials.
Data You Need Before Calculating Safety Stock
Daily usage, lead time, service level, and standard deviation are the four inputs a safety stock calculation needs, and your production and receiving records supply most of them.
- Record the average and peak daily usage from production logs or warehouse withdrawal records.
- Measure lead time from the order date until the material passes inspection and is ready to use, then compare it with the delivery schedule in your supply contract.
- Set a service level, such as 95 percent, which is the chance that stock will not run out during one order cycle.
- Calculate the standard deviation of usage and of lead time to measure how far daily figures stray from the average.
Use records long enough to cover both quiet and busy periods, ideally a full season.
Common Formulas for Calculating Safety Stock
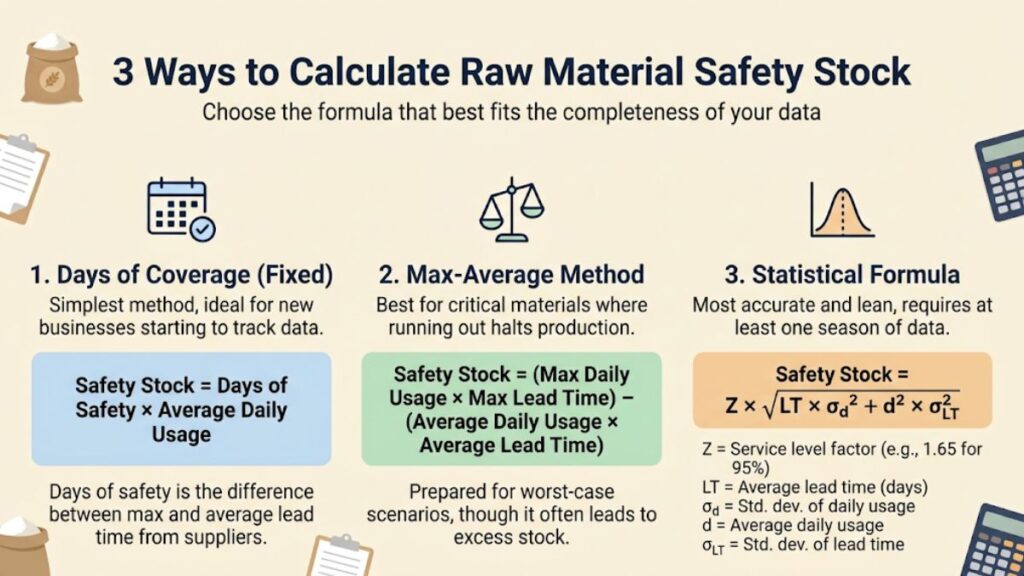
Three formulas are in common use, and the right one depends on the data you have already recorded. The buffer days formula needs only average usage, while the statistical formula needs standard deviation and a service level.
Fixed Buffer Days
The fixed buffer method multiplies a set number of buffer days by average daily usage.
Safety stock = buffer days × average daily usage
A practical rule is to set the number of days at the gap between the supplier’s longest and average lead times. If usage is stable, the result equals the maximum value formula below.
Maximum Value Formula
The maximum value formula compares the worst case with the average case, so it needs only average and peak values.
Safety stock = (maximum daily usage × maximum lead time) – (average daily usage × average lead time)
The result tends to run high because the formula assumes peak usage and the longest delay happen at the same time.
Statistical Formula With a Service Level
The statistical formula uses standard deviation to measure how far usage and lead time typically stray from their averages.
Safety stock = Z × √(LT × σd² + d² × σLT²)
- Z: service level factor
- LT: average lead time (days)
- σd: standard deviation of daily usage
- d: average daily usage
- σLT: standard deviation of lead time (days)
The Z value follows the service level you target. A higher target produces a larger Z and a larger safety stock.
An APICS magazine article on safety stock equations lists a Z of 1.65 for a 95 percent service level, and the example below uses that value.
If only usage fluctuates, the formula becomes Z × σd × √LT, and if only lead time fluctuates, it becomes Z × σLT × d.
Choosing the Formula That Fits Your Data
The table below summarizes the data each formula needs and where it falls short.
| Formula | Data needed | Best for | Weakness |
|---|---|---|---|
| Buffer days | Average daily usage and number of buffer days | Businesses just starting to keep records | Ignores usage spikes |
| Maximum value | Average and peak values for usage and lead time | Materials whose stockout would halt production | Reserve tends to run high |
| Statistical | Average and standard deviation of usage and lead time, plus a service level | Businesses with a full season of records | Needs long records and a more complex calculation |
The table shows that the data you have already recorded decides which formula you can use, not the size of your business. Start with the formula whose data you already have, then move to the statistical formula once your records cover a full season.
How to Calculate Safety Stock: A Wheat Flour Example
Suppose a bakery uses an average of 40 kg of wheat flour per day. With the data in the table below, the three formulas above give a safety stock between 103 kg and 280 kg.
| Data | Example value |
|---|---|
| Average daily usage | 40 kg |
| Peak daily usage | 60 kg |
| Standard deviation of daily usage | 8 kg |
| Average lead time | 5 days |
| Longest lead time | 8 days |
| Standard deviation of lead time | 1.5 days |
| Service level | 95 percent (Z = 1.65) |
| Flour per bag | 25 kg |
Safety stock covers the gap between average conditions and the worst case. In this example, usage can rise 20 kg above average and a delivery can arrive 3 days late.
The figures in the table are illustrations only. Replace them with your own usage and receiving records.
- Calculate with buffer days: the longest delay is 3 days (8 – 5), so 3 × 40 kg = 120 kg.
- Calculate with the maximum value formula: (60 × 8) – (40 × 5) = 480 – 200 = 280 kg.
- Calculate with the statistical formula: 1.65 × √(5 × 8² + 40² × 1.5²) = 1.65 × √3,920 = about 103 kg.
- Set the reorder point, the stock level that triggers a new order, by adding usage during lead time (40 × 5 = 200 kg) to safety stock. The result is 303 kg with the statistical formula and 480 kg with the maximum value formula.
The maximum value formula gives almost three times the statistical result. The statistical formula is leaner because it targets a 95 percent service level, so the chance of a stockout in one order cycle stays at about 5 percent.
If the supplier always delivers in exactly 5 days, the statistical safety stock drops to about 30 kg. The gap between 30 kg and 103 kg comes from uncertain lead time, so a consistent delivery schedule directly shrinks the reserve.
Adjusting Safety Stock to Fit Dry Raw Materials
Check the formula result against four practical limits in your warehouse, namely package size, shelf life, storage capacity, and minimum order quantity.
- Round the result up to whole packages. In the example, 103 kg becomes 5 bags of 25 kg, or 125 kg.
- Check shelf life by dividing safety stock by daily usage, which gives about 3 days of cover in the example. That figure should stay well below the material’s remaining shelf life on arrival, and a FEFO (first expired, first out) system uses the batch closest to expiration first.
- Make sure your warehouse storage space can hold the safety stock plus one regular order. If it cannot, order more often instead of piling up bags.
- Check the supplier’s minimum order quantity. If the minimum is larger than your need, the stock actually on the shelf will exceed the calculated figure.
Dry materials such as flour and sugar also absorb moisture from the air easily, so reserves stored for a long time in a humid warehouse can clump or spoil. That is why warehouse conditions and the formula result both set the upper limit of safety stock.
Read also: FIFO Stock Rotation SOP for Dry Ingredients: A Practical Guide
When to Recalculate Safety Stock
Recalculate safety stock whenever usage or lead time changes, and schedule a routine review before each busy season.
- Before Eid al-Fitr (Lebaran in Indonesia) or Christmas, peak daily usage can rise, so add that season’s data to the formula.
- A new supplier or delivery route changes lead time and delivery reliability.
- A new recipe or menu changes the amount of material used per production run.
- A material that ran out or piled up signals that the previous calculation was off.
Read also: Consistent Supply: Must-Have Strategies for Large-Scale Catering
Conclusion
Calculating safety stock for dry raw materials means choosing the formula that fits the usage and lead time data you have already recorded. Buffer days and the maximum value formula are enough to start with, while the statistical formula gives a leaner reserve once your records cover a full season.
Your first step is to record daily usage and receiving dates for your main material over one seasonal cycle. After that, check the result against shelf life and warehouse capacity.

FAQ
Do Small Food Businesses Need to Calculate Safety Stock?
Yes, especially for main materials whose stockout would halt production. Small businesses with limited records can start with the buffer days formula.
What Service Level Should You Choose?
Start at 95 percent for main materials. Raise it if the material has no substitute, and lower it if it is easy to buy locally.
Is Safety Stock the Same as Buffer Stock?
In practice, the two terms often mean the same thing, a reserve that covers uncertainty in usage and delivery.
How Do You Calculate Safety Stock in Excel?
Use AVERAGE for the mean and STDEV.S for the standard deviation of usage and lead time, then find the Z value with NORM.S.INV. For a 95 percent service level, enter 0.95 in NORM.S.INV (the result is very close to the 1.65 used above) and place it in the statistical formula.